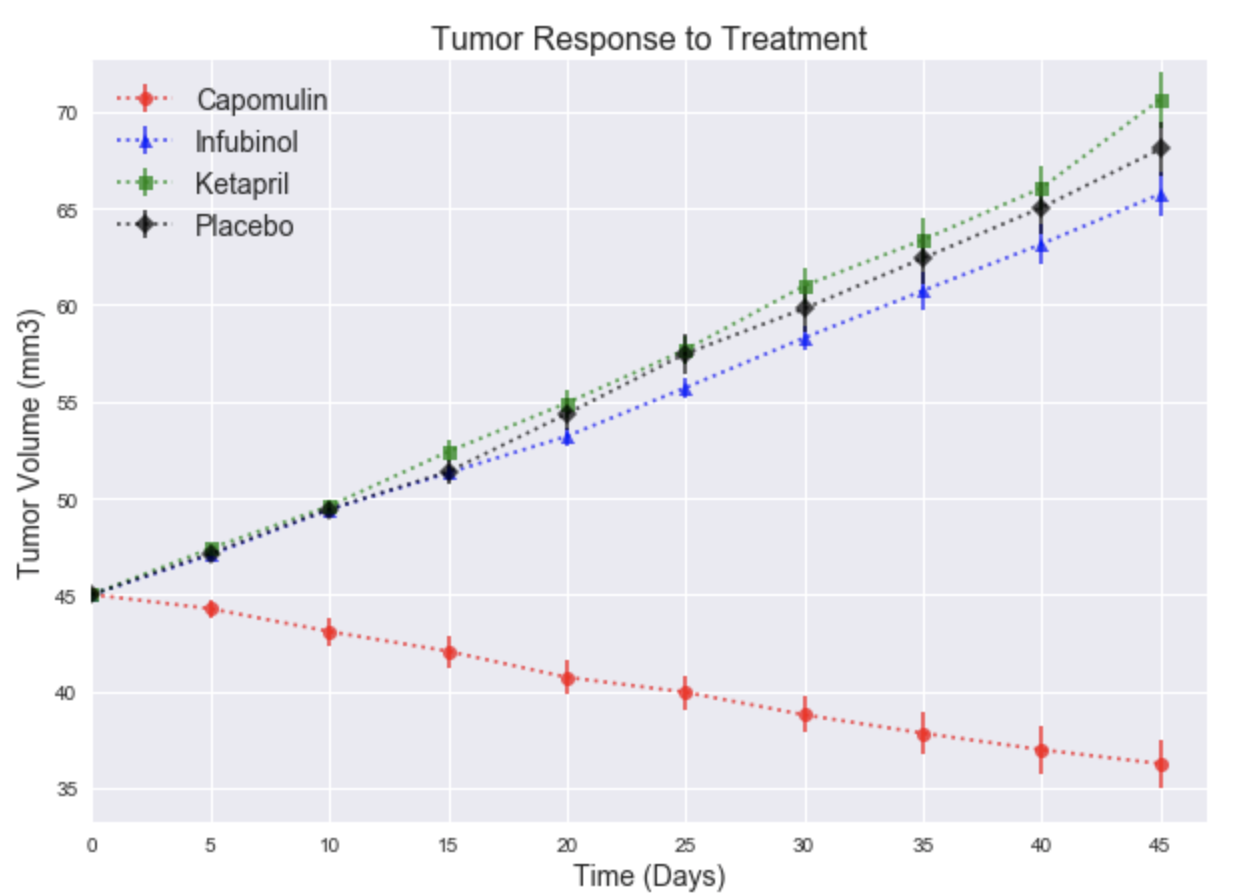
Tumor Response to Treatment
This graph shows that mice taking Capomulin saw the volume of their tumors shrink, while all mice taking the other two drugs and the placebo saw their tumor volume grow. The graph was built using matplotlib, and includes error bars for the standard error for the means.
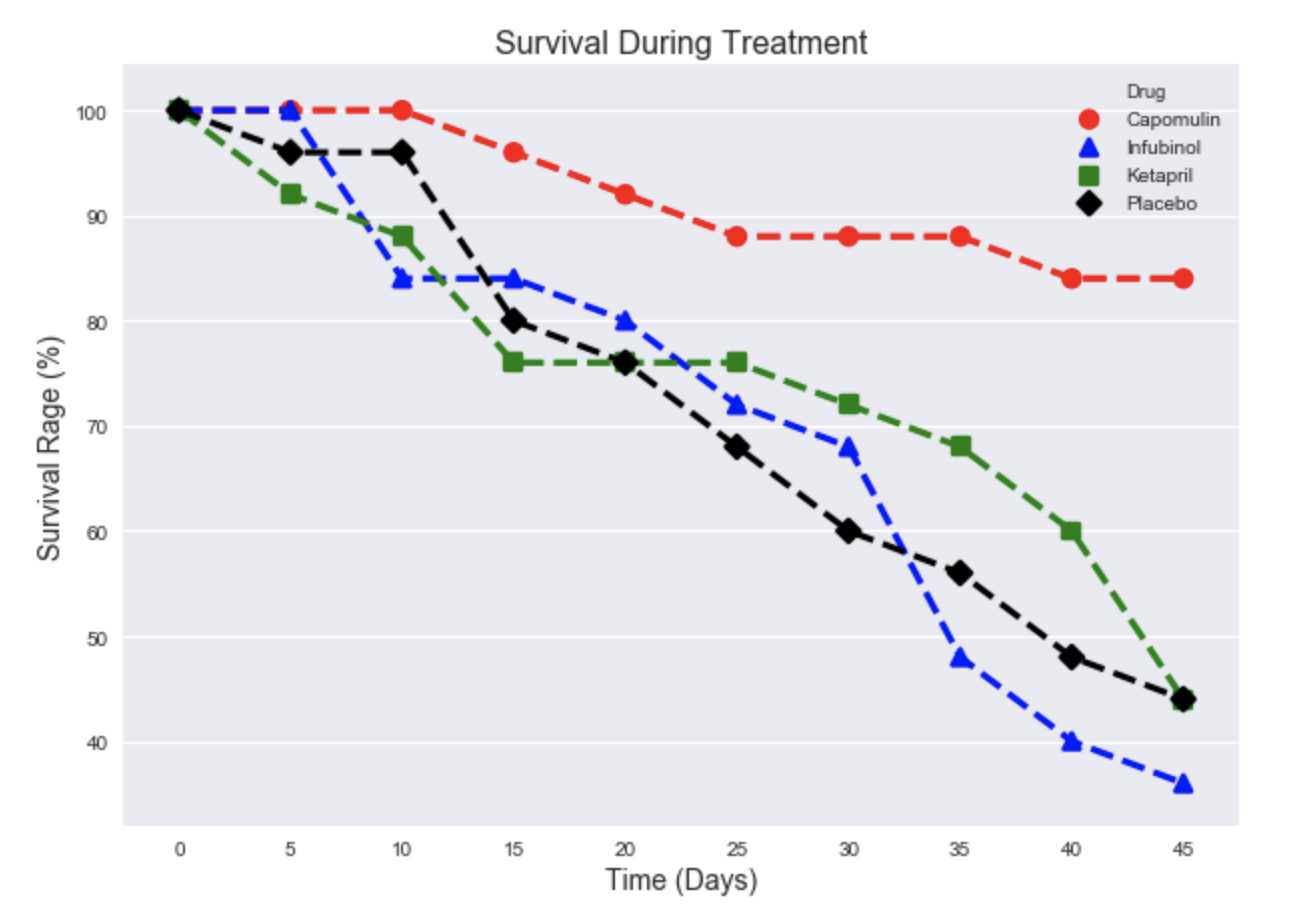
Survival Rate
This graph shows that more mice taking Capomulin survived, while mice taking the other two drugs and the placebo died at a faster rate. The graph was built using matplotlib.
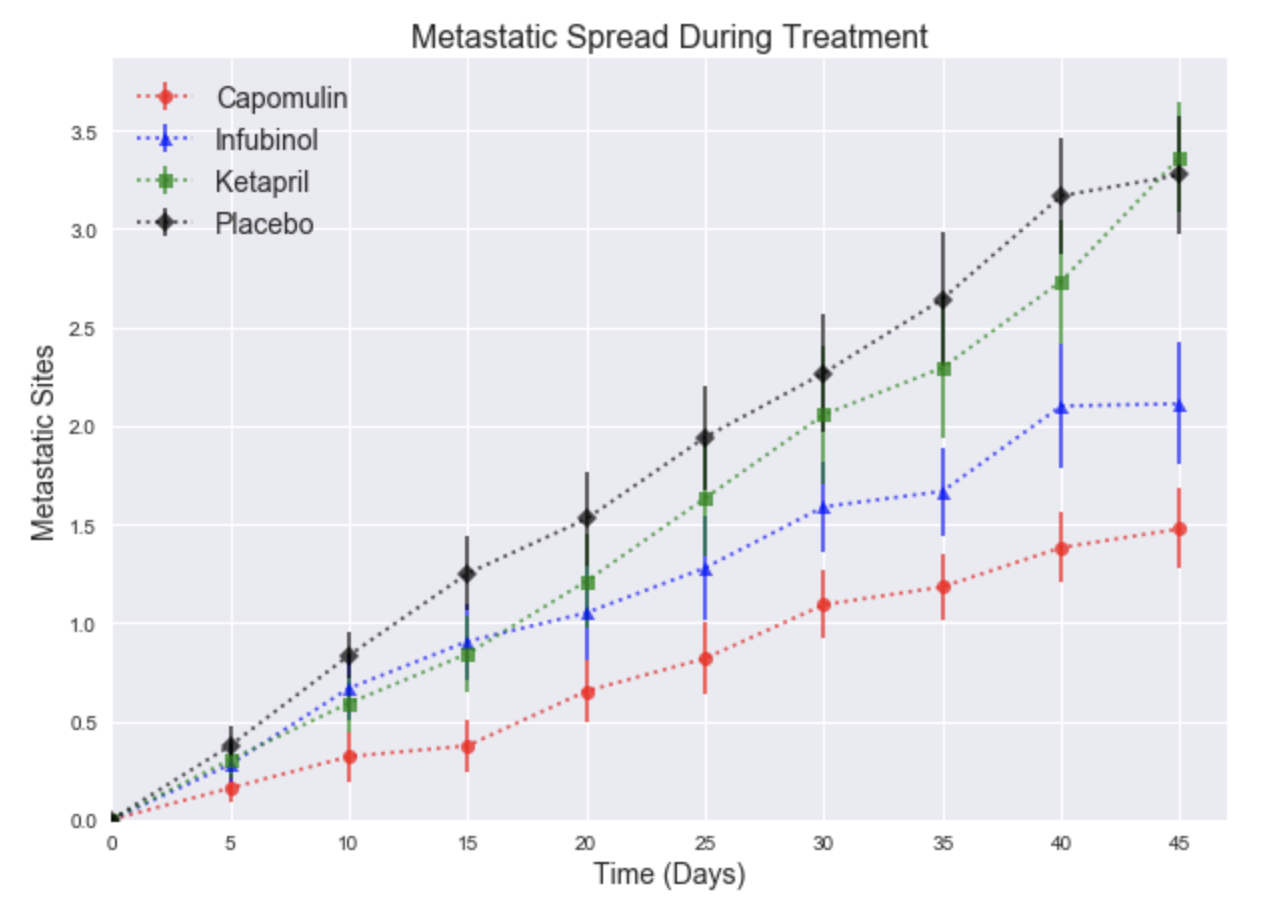
Metastatic Spread
This graph shows that all tumors had metastatic spread, regardless of the treatment. Mice taking Capomulin had the slowest metastatic spread, while mice taking the placebo had the fastest spread, as would be expected. The graph was built using matplotlib, and includes error bars for the standard error for the means.
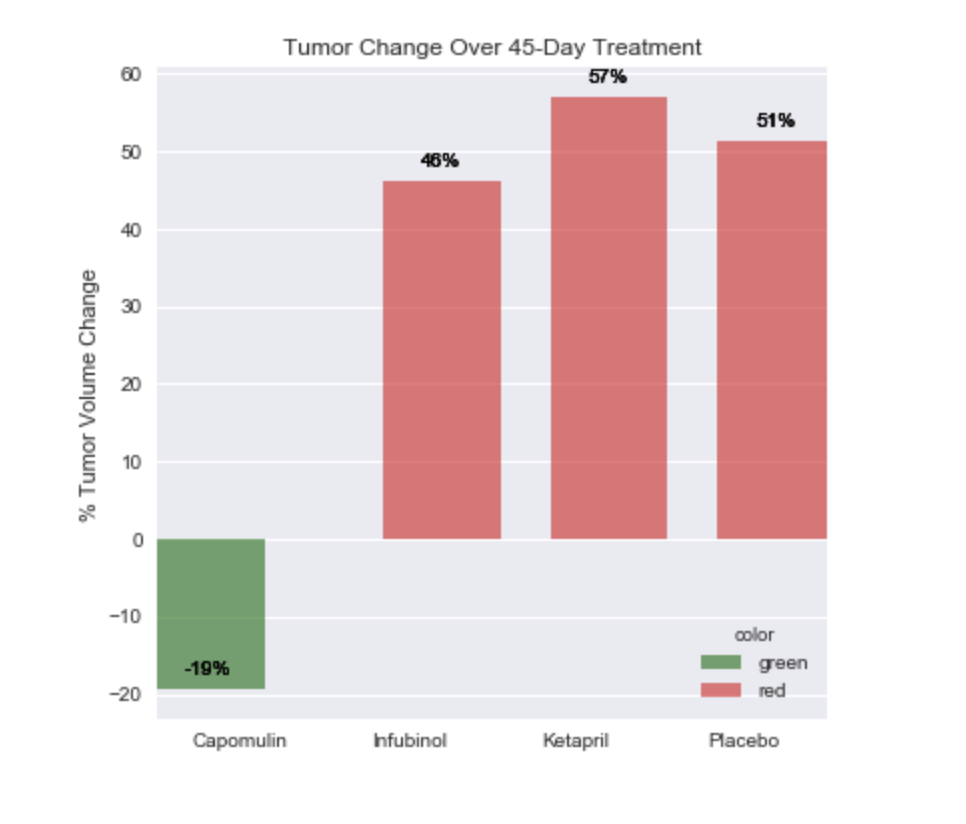
Percent Change in Tumor Volume
This graph shows the percent change in tumor volume over the course of the trial. Mice taking Capomulin saw the volume of their tumors shrink by 19%, while all mice taking the other two drugs and the placebo saw their tumor volume grow between 46 and 57%. The graph was built using Seaborn.