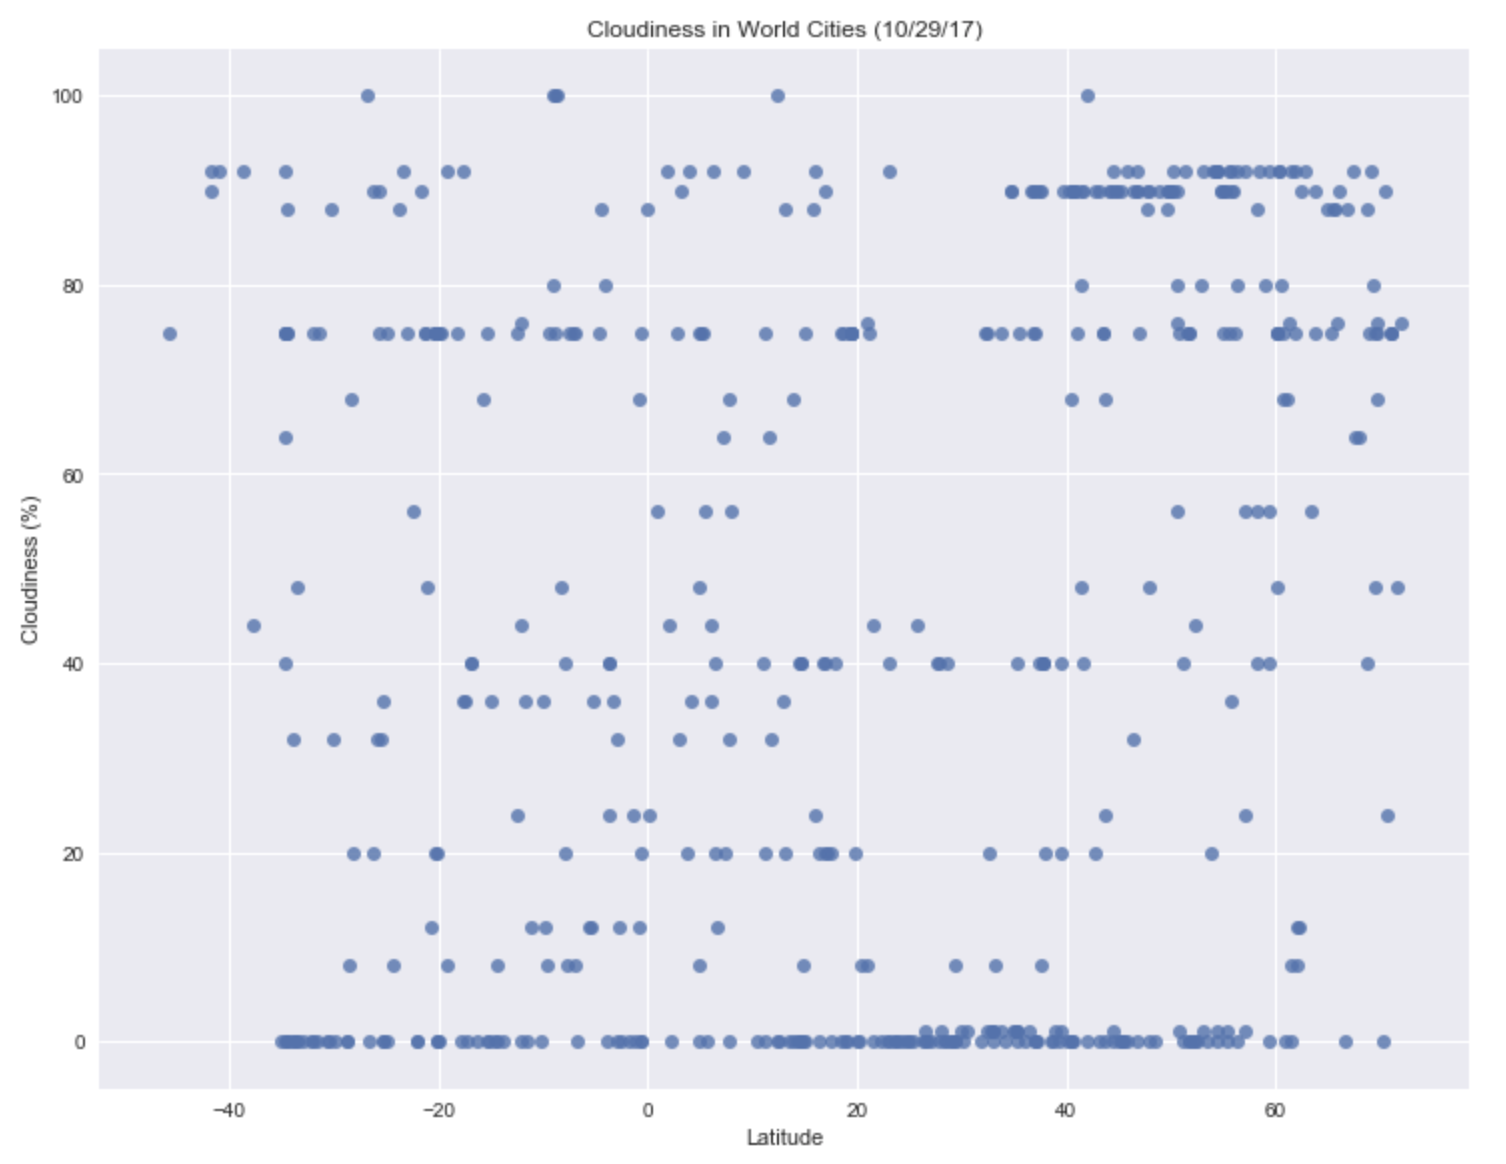
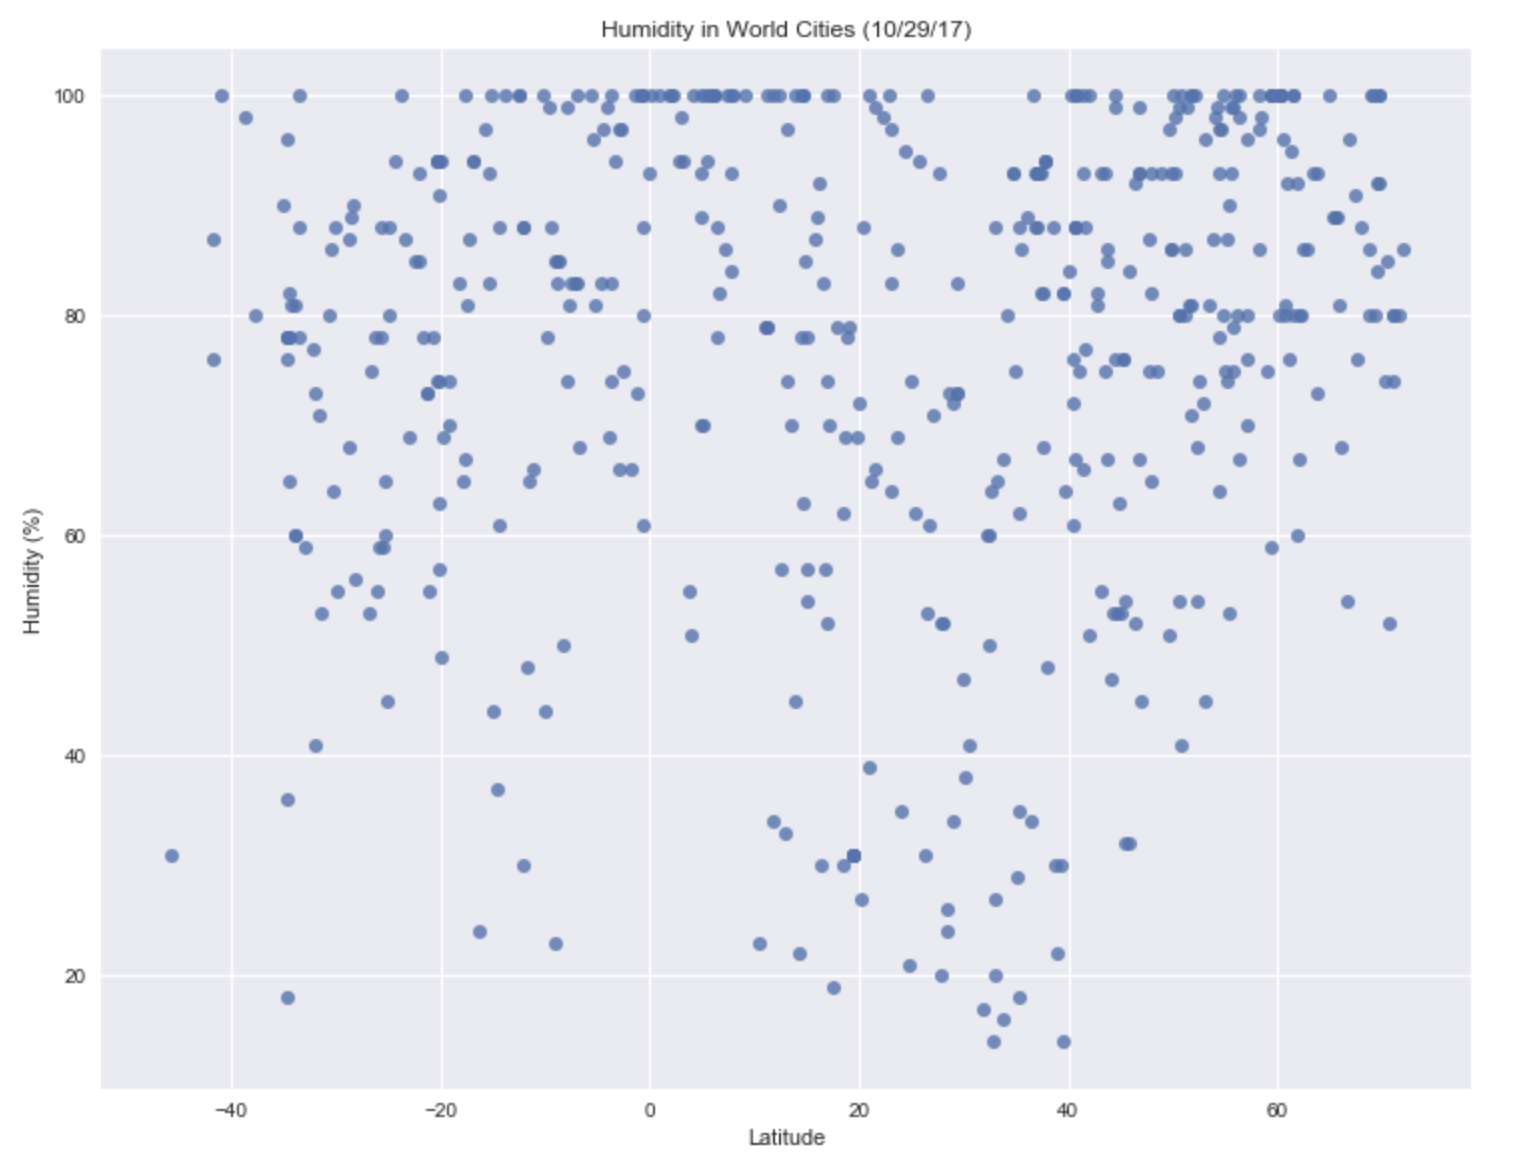
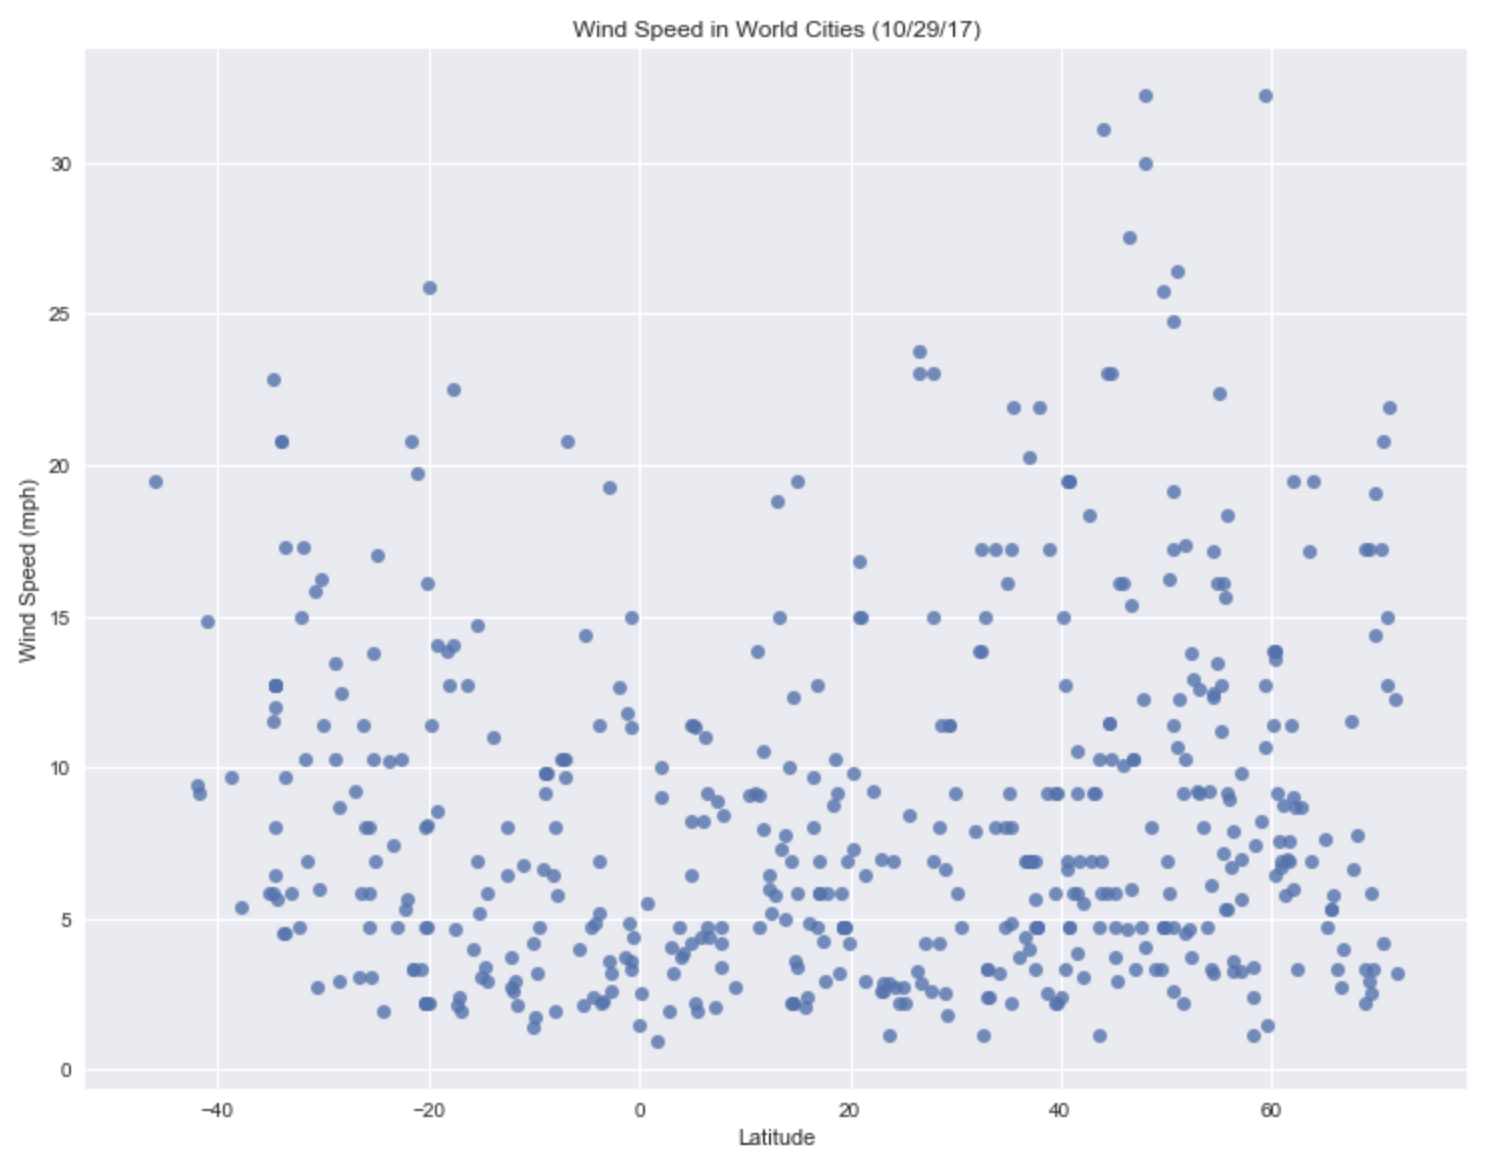
Summary: Latitude vs X
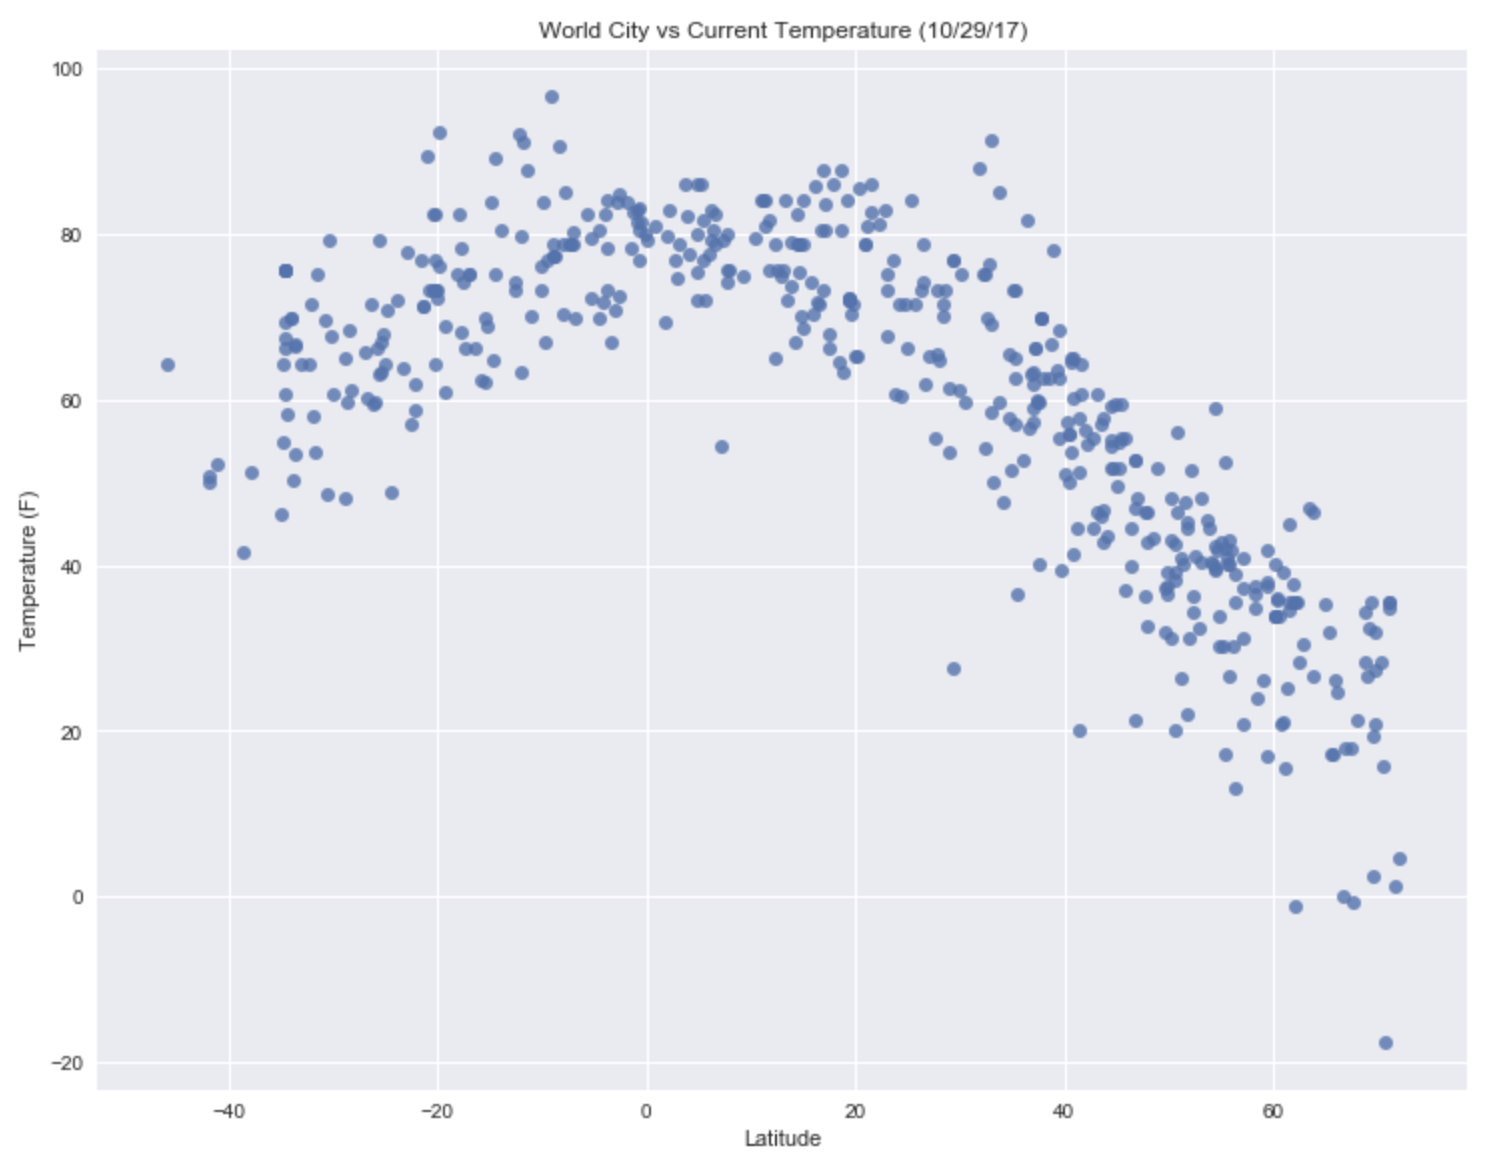
The purpose of this project was to analyze how weather varies based on proximity to the equator. To accomplish this analysis, I first pulled data from the OpenWeatherMap API to assemble a dataset with 500 random cities.
After assembling the dataset, I used Matplotlib to plot various aspects of the weather vs. latitude. Factors considered were: temperature, cloudiness, wind speed, and humidity. This site provides the source data and visualizations created as part of the analysis, as well as explanations and descriptions of any trends and correlations observed.